Jack and I are working on a new research paper that addresses a very simple question:
Can investors improve their screening process by eliminating frauds, manipulators, and financially distressed firms?
Answering this question appears easy, but as Cliff Asness and Andrea Frazzini point out in their recent paper, “The Devil in HML’s Details,” the devil is REALLY in the details.
- How does one identify frauds?
- How does one identify manipulators?
- How does one identify financially distressed firms?
- And most importantly, how does one identify frauds, manipulators, and financially distressed firms BEFORE the market has already priced in the risks of fraud, manipulation, or distress?
Luckily, we can stand on the shoulders of academic research (and create our own!) and take a stab at addressing our original question. The academic literature describes techniques that help identify frauds, manipulators, and financially distressed firms before the market.
Here is a helicopter tour of the literature we enjoy most:
Frauds and manipulators:
- Beneish (1999): The Detection of Earnings Manipulation
- Sloan (1996): Do Stock Prices Fully Reflect Information in Accruals and Cash Flows About Future Earnings?
- Hirshleifer et al. (2004): Do Investors Overvalue Firms with Bloated Balance Sheets?
Financial Distress:
- Campbell, Hilscher, and Szilagyi (2008): In Search of Distress Risk (Discussion Piece that is more “Barney Style”)
- Campbell, Hilscher, and Szilagyi (2010): Predicting Financial Distress and the Performance of Distressed Stocks (similar to above but with data out to 2008, see Table 2 and compare to Table IV in older version)
Preliminary Chart Porn:
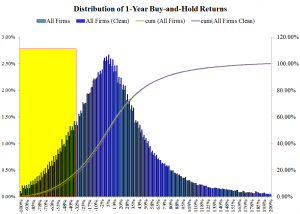
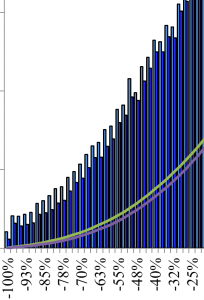
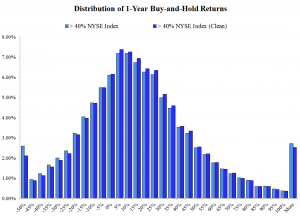
First, a look at the entire distribution of firms’ 1-year Buy-and-hold 1-year returns from 1973 through 2011.

[Click to Enlarge] The results are hypothetical results and are NOT an indicator of future results and do NOT represent returns that any investor actually attained. Indexes are unmanaged, do not reflect management or trading fees, and one cannot invest directly in an index. Additional information regarding the construction of these results is available upon request.

[Click to Enlarge] The results are hypothetical results and are NOT an indicator of future results and do NOT represent returns that any investor actually attained. Indexes are unmanaged, do not reflect management or trading fees, and one cannot invest directly in an index. Additional information regarding the construction of these results is available upon request.

[Click to Enlarge] The results are hypothetical results and are NOT an indicator of future results and do NOT represent returns that any investor actually attained. Indexes are unmanaged, do not reflect management or trading fees, and one cannot invest directly in an index. Additional information regarding the construction of these results is available upon request.
How did we create this?
In short, it’s complicated.
We calculate scores on all the fraud, manipulation, and distress factors outlined in the papers above, and eliminate any firms in the bottom 5% (the real scum of the earth).
If you want a more detailed overview of the process, check out our book, Quantitative Value.
About the Author: Wesley Gray, PhD
—
Important Disclosures
For informational and educational purposes only and should not be construed as specific investment, accounting, legal, or tax advice. Certain information is deemed to be reliable, but its accuracy and completeness cannot be guaranteed. Third party information may become outdated or otherwise superseded without notice. Neither the Securities and Exchange Commission (SEC) nor any other federal or state agency has approved, determined the accuracy, or confirmed the adequacy of this article.
The views and opinions expressed herein are those of the author and do not necessarily reflect the views of Alpha Architect, its affiliates or its employees. Our full disclosures are available here. Definitions of common statistics used in our analysis are available here (towards the bottom).
Join thousands of other readers and subscribe to our blog.

